Description
In the world of construction, quality control plays a pivotal role in ensuring the structural integrity and longevity of buildings and infrastructure. MIRA Concrete Tomography is a revolutionary technology that is transforming the way we inspect and evaluate concrete structures, delivering unprecedented insights and enhancing construction quality. This article explores the significance of MIRA Concrete Tomography and its applications in the construction industry.
What is MIRA Concrete Tomography?
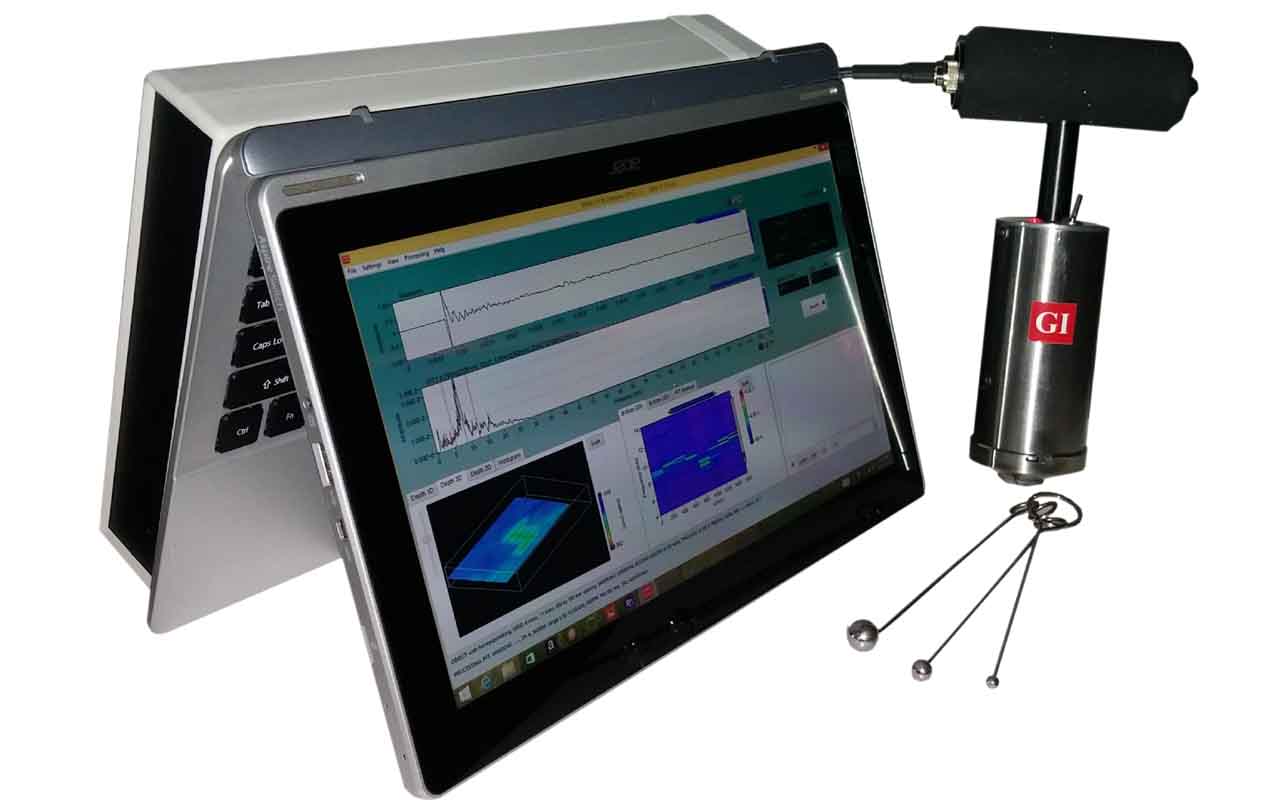
MIRA Concrete Tomography is an advanced non-destructive testing (NDT) method that uses electromagnetic waves to create high-resolution images of the internal structure of concrete elements. This innovative technology allows for the detection of voids, cracks, and other imperfections within concrete without causing any damage to the structure itself. MIRA is short for Microwave and Radar.
Optimizing MIRA Concrete Tomography for Quality Control:
- Enhanced Structural Analysis: One of the primary applications of MIRA Concrete Tomography is the detailed analysis of concrete structures. By using microwave and radar technology, it provides precise images of the concrete’s internal composition. This level of insight helps engineers and construction professionals identify defects, assess the quality of construction, and make informed decisions for repair or reinforcement.
- Non-Destructive Testing: Traditional methods for assessing concrete structures often involve destructive testing, which can be costly and time-consuming. MIRA eliminates the need for destructive testing, allowing for thorough inspections without causing harm to the structure. This not only saves time but also reduces the overall project costs.
- Quality Assurance: In the construction industry, quality assurance is paramount. MIRA Concrete Tomography significantly improves quality control processes. It offers unparalleled accuracy in detecting issues such as honeycombing, voids, and delamination, ensuring that the final structure meets industry standards and safety requirements.
- Safety: Ensuring the safety of concrete structures is of utmost importance. MIRA Concrete Tomography helps in identifying potential hazards within the structure, reducing the risk of structural failures. This technology can be a game-changer in maintaining the safety of buildings, bridges, and other critical infrastructure.
- Reduced Downtime: Traditional concrete inspection methods often require shutting down construction sites, causing project delays and additional costs. With MIRA Concrete Tomography, inspections can be performed while construction is ongoing, minimizing downtime and ensuring that projects stay on schedule.
MIRA Concrete Tomography and Avantech:
Avantech, a leading provider of innovative solutions for the construction and civil engineering industries, offers cutting-edge MIRA Concrete Tomography services. By partnering with Avantech, construction professionals can benefit from the expertise of a team that is at the forefront of this technology. Avantech’s commitment to quality and innovation aligns perfectly with the capabilities of MIRA Concrete Tomography.
Conclusion:
MIRA Concrete Tomography is a transformative technology that is optimizing the way we assess and ensure the quality of concrete structures. By offering non-destructive, precise, and cost-effective solutions for quality control, MIRA has become an indispensable tool in the construction industry. With its applications for structural analysis, quality assurance, safety, and reduced downtime, MIRA Concrete Tomography is an invaluable resource for engineers and construction professionals.
For comprehensive MIRA Concrete Tomography services and to learn more about how this technology can benefit your construction projects, visit Avantech’s website today. With Avantech’s expertise and MIRA’s capabilities, you can elevate the quality and safety of your construction projects to new heights.


Reviews
There are no reviews yet.